


R&D is crucial for economic growth, driving advancements in various industries, including in the energy sector. PHMSA’s Pipeline Safety R&D Program fosters new technologies to improve pipeline safety and regulatory compliance. PHMSA’s investment in R&D is vital to driving safety in areas that might otherwise be neglected by the private sector due to high risk and uncertain short-term profitability.
PHMSA’s support is essential for advancing these important but potentially less lucrative technologies, and champions three principles:
- Early planning for technology transfer.
- Continuous engagement with end-users (pipeline operators and regulators).
- Timely integration of potential service providers.
Transparency is maintained through R&D forums, pre-award reviews, and contractual milestones, aligning technology needs with identified threats. Projects also undergo regular evaluation and adjustments to ensure alignment with programmatic research priorities. PHMSA’s program focuses on short-term (1-3 year) solutions, while recognizing that some technologies require up to five years for commercialization. Additionally, proof-of-concept research is a prerequisite for investment in deployable solutions.
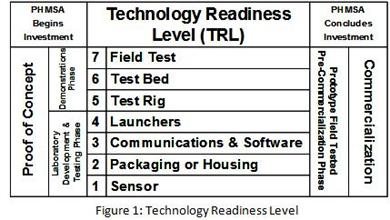
This process is illustrated in the Technology Readiness Level (TRL) diagram (Figure 1), which outlines the seven stages of technology development, from initial concept to field testing and commercialization. Understanding these stages, and where PHMSA investment is focused, is crucial for effective technology transfer and ultimately realizing the benefits of R&D investments. PHMSA’s investment typically concludes before the later more commercially focused stages of development.
Technology demonstrations are essential for validating field applicability. PHMSA conducts formal demonstrations periodically to test technologies under realistic conditions—progressing from test rigs to test beds and finally to operational pipelines—to ensure the technologies are ready for real-world application.
PHMSA is coordinating with researchers, end users, and known commercial vendors to commercialize technology and measure its impact. The following section documents program progress and our collaborative success since 2002.
Program Status: Technology Impacts
| Technology Impact Metric | Metric | Meter |
|---|---|---|
| Technology Projects | 158 | |
| Technology Demonstrations | 79 | |
| Patent Applications (U.S. + Other) | 53 | |
| Patents Granted (U.S. + Other) | 29 | |
| Commercialized TechnologiesA | 36 | |
| Commercialization Success RateA | 26% |
- The measurement of "Commercialized Technologies" only occurs on non-active or completed projects.
| Category | Technology Projects | Technology Demonstrations | Patent Applications (U.S. + Other) | Patents Granted (U.S. + Other) | Commercialized TechnologiesA | PHMSA ($M) |
|---|---|---|---|---|---|---|
| Threat Prevention | 49 | 20 | 12 | 4 | 8 | $25.28M |
| Leak Detection | 21 | 11 | 1 | 1 | 6 | $11.33M |
| Anomaly Detection | 46 | 34 | 28 | 16 | 17 | $32.27M |
| Anomaly Characterization | 9 | 3 | 6 | 4 | 1 | $ 4.32M |
| Anomaly Repair | 1 | 1 | 2 | $ 0.99M | ||
| Pipe Remediation/Rehabilitation | 3 | $ 2.37M | ||||
| Materials | 13 | 1 | 2 | 2 | 1 | $14.28M |
| Welding | 8 | 5 | 1 | 1 | 2 | $ 5.58M |
| Joining | 4 | 3 | 1 | 1 | 1 | $ 2.00M |
| Underground Natural Gas Storage | 4 | 1 | $ 2.39M | |||
| Grand Totals: | 158 | 79 | 53 | 29 | 36 | 100.86M |
- Note: The measurement of "Commercialized Technologies" only occurs on non-active or completed projects.